

A DIY project uses an Arduino Uno and an optocoupler to watch mains frequency, showing both live readings and long-term trends.
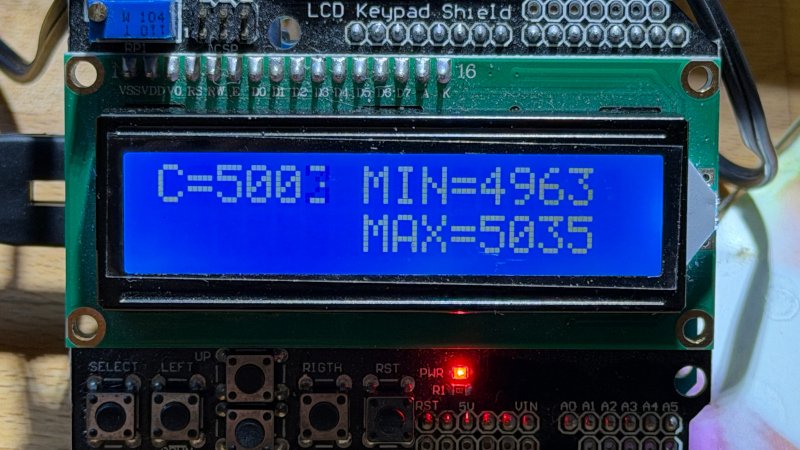
Most people know their electrical grid runs at 60Hz in the United States or 50Hz in Europe, but the actual frequency is not perfectly fixed. In a large, interconnected network such as Europe's, it can wander slightly around its nominal value. To capture these changes, Jeroen Brinkman built a grid monitor that displays both instantaneous frequency and longer-term patterns.
The hardware is deliberately simple, built around an Arduino Uno and a common 2×16 character LCD. The microcontroller itself is not the interesting part. Measuring mains voltage directly is dangerous, so the design uses an optocoupler that switches an interrupt pin on the board, keeping the high-voltage side isolated from the electronics.
Long-term data is stored weekly, using just four bytes for each week. According to the project, that allows roughly 240 weeks, about 4.6 years, on a Nano R3, and more than 2,000 weeks, around 39 years, on a Nano R4. The recorded data can be pulled off the device over the Arduino's USB port using serial transfer.
Grid frequency is more than a technical curiosity, since geopolitical events can leave a visible trace in it. Hackaday has previously reported on one such case, when Europe's grid lost six seconds in 2018.
Source: Hackaday